

Light at the End of the Tunnel?


1. Plateaus
The good news is that the national peak in coronavirus cases is far enough behind us that we can start to hope that it really was the peak and not just the top of the first wave.
This hope may turn out to be false—we could see another wave. The virus could spike in enough smaller metropolitan areas that it then breaks out of control again.
But let's live for a minute with the hope that we might be coming out the other side of this mess.
There are two aspects of the data I want to call your attention to.
The first is that we are most certainly not seeing a Gaussian distribution. The way down looks to be a lot less steep than the climb up (courtesy of the NYT):

If this trend line continues, it means that even the ramp-down phase will be a slog and a lot more people are going to die from COVID-19 even while we are "winning."
The second is that as the daily number of tests increases—and it is definitely better now, though it is still not adequate to what we need—we need to get our arms around the false-positive numbers.
This is a point that my buddy the data nerd Buckaroo Bonzai made to me late last week.
All tests have failure rates. That's just the nature of testing. I have not been able to figure out what the failure rates for the various coronavirus tests are. (Which one more reason why we ought to have a single standardized test that everyone is using.)
But when BB ran the numbers taking into account various false-positive rates, he found that the curves look really different if the failure rate is 1 percent or, say, 3 percent. Have a look:
There are a few possible ways to think about what factors are driving what we're seeing in the data:
(1) The false positive problem. In this view, the situation is currently better than we think. If the false positive rate is relatively high—let's pretend it's 3 percent—then with testing at scale you get a lot of "new cases" that aren't real infections. This would be good news.
(2) The undercount problem. In this view, our initial undercount (due to lack of testing) was so high that things were much worse than we knew. Which is why the current numbers look so good. In this view, the actual peak was bigger and further in the past than the current data shows. It's still good news for the current outlook, but not as good.
(3) The baseline rate of growth problem. In this view, things might actually be worse than we think right now, because all of those cases from the peak are inactive right now, which means that the new cases we're seeing come from a smaller population of infections. (This brings us back to the base-infection rate numbers which we've talked a lot about.)
(4) No one knows anything. If you want to get really depressed, here's BB with some data nihilism:
One of the problems we have is that the very metrics we are trying to use keep changing. At the start of this, only symptomatic people were tested, and many of those were turned away. Now many more are tested, but it is still targeted; if someone tests positive then teams of testers run around their neighborhood or building to test people. This is better from a “finding the sick people” standpoint but a disaster from a metric standpoint. The metric meant one thing, and then is slowly changing to mean something else. Also, the noise in the data is enormous, and even a 7 day running average is too little filtration. As far as I can tell, we can’t see any useful trends on a scale less than two weeks.
And you thought I was dark.
2. Time Horizons
In general, humans are not great at thinking over the time horizon. We live mostly in the now and sometimes in the tomorrow.
But thinking way, waaay out over the horizon to, say, 10,000 years from now? That's really hard. And so we don't do it much.
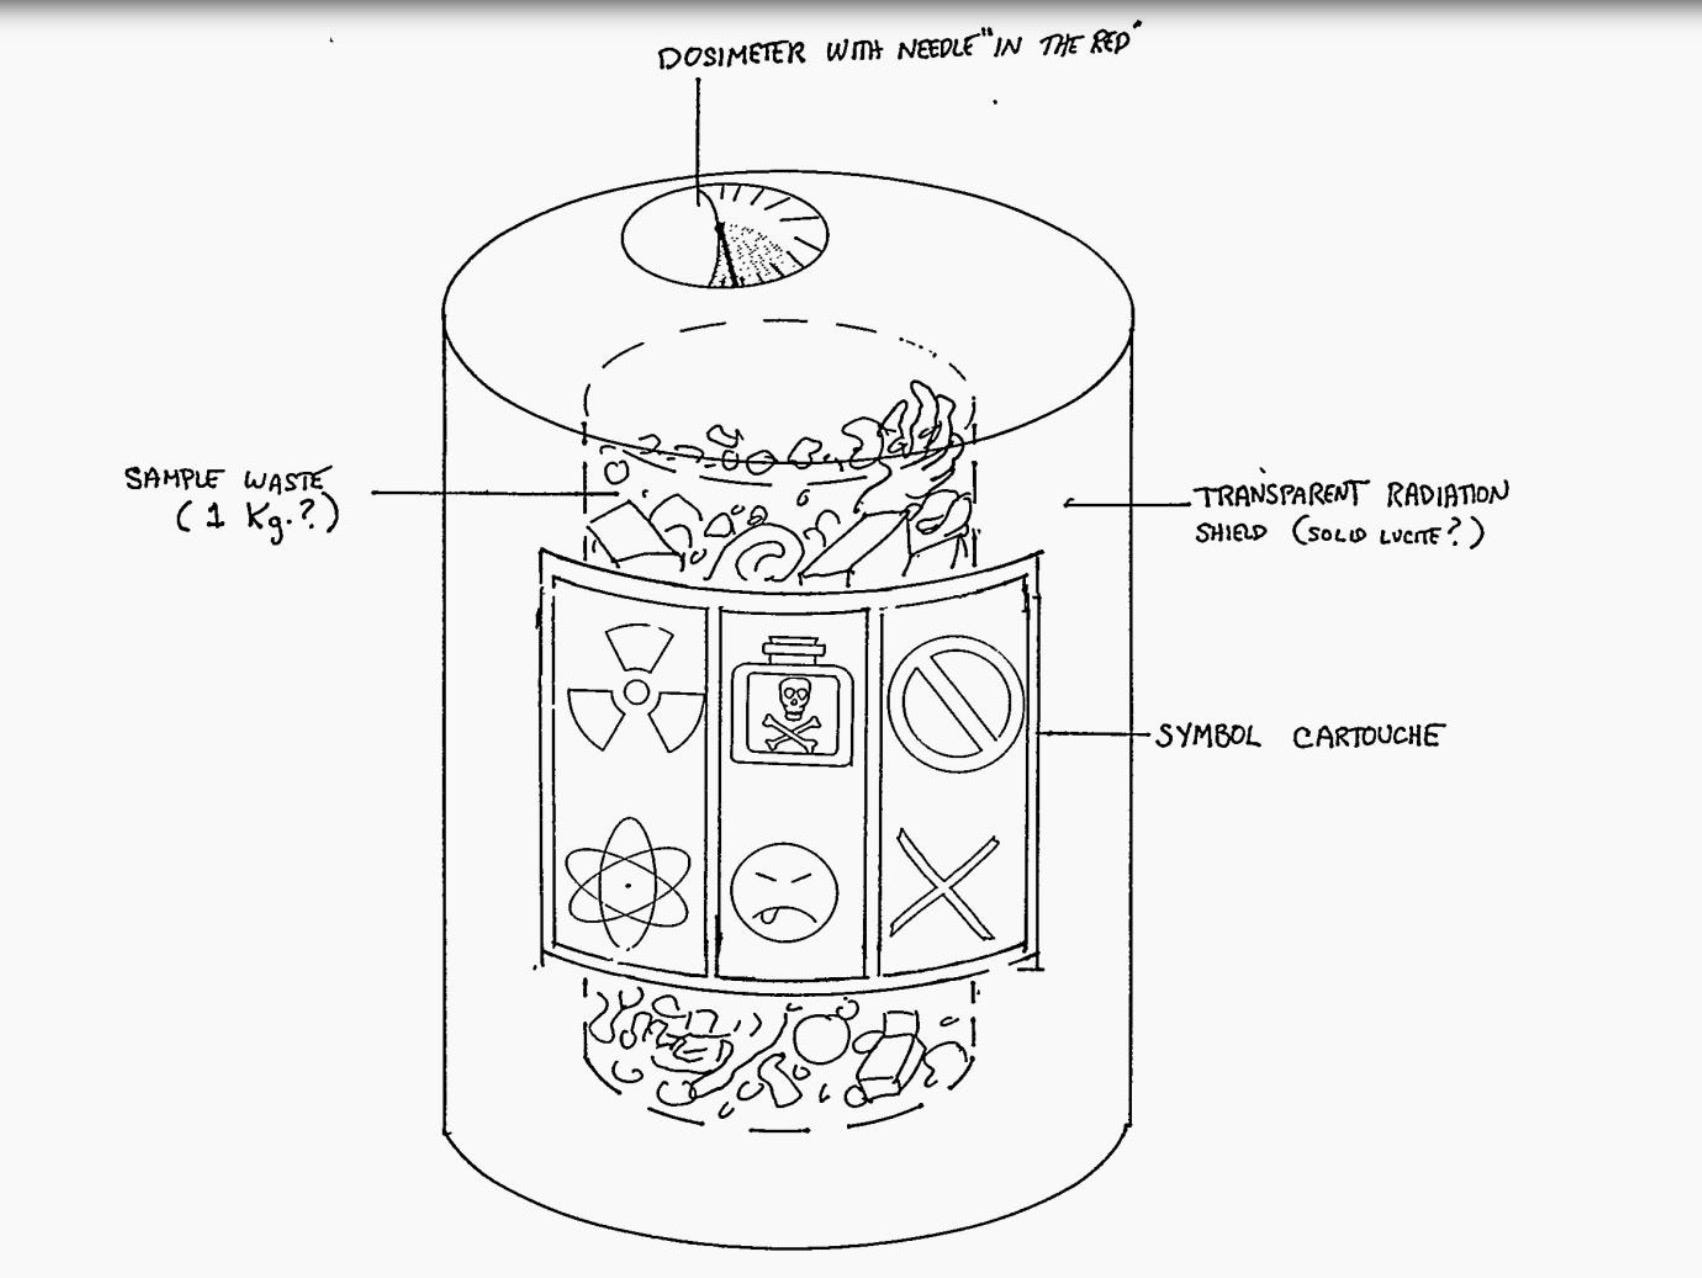
A reader sent me a digitized copy of a report put out in 1993 by the Sandia National Laboratories. The goal of the exercise was to come up with a marker system to deter people from going into the Waste Isolation Pilot Plant, where the government stores a whole lot of dangerous nuclear waste.
The challenge was to make these markers effective over a long time horizon, which included every possibility from a future that looked like Mad Max to a future that looks like Star Wars:
The period of regulatory concern is 10,000 years. The expert panel identified basic principles to guide current and future marker development efforts: (1) the site must be marked, (2) message(s) must be truthful and informative, (3) multiple components within a marker system, (4) multiple means of communication (e.g., language, pictographs, scientific diagrams), (5) multiple levels of complexity within individual messages on individual marker system elements, (6) use of materials with little recycle value, and (7) international effort to maintain knowledge of the locations and contents of nuclear waste repositories. The efficacy of the markers in deterring inadvertent human intrusion was estimated to decrease with time, with the probability function varying with the mode of intrusion (who is intruding and for what purpose) and the level o technological development of the society. The development of a permanent, passive marker system capable of surviving and remaining interpretable for 10,000 years will require further study prior to implementation.
Kind of neat, yes?
You can download the report to skim through it here. Or go to the scanned version here. As an exercise in symbology it's pretty interesting.
In the end, they come up with a few ideas, one of which is this:
3. Lord of the Flies
When a real world Lord of the Flies situation happened, the boys didn't go Lord of the Flies:
The kids agreed to work in teams of two, drawing up a strict roster for garden, kitchen and guard duty. Sometimes they quarrelled, but whenever that happened they solved it by imposing a time-out. Their days began and ended with song and prayer. Kolo fashioned a makeshift guitar from a piece of driftwood, half a coconut shell and six steel wires salvaged from their wrecked boat – an instrument Peter has kept all these years – and played it to help lift their spirits. And their spirits needed lifting. All summer long it hardly rained, driving the boys frantic with thirst. They tried constructing a raft in order to leave the island, but it fell apart in the crashing surf.
Worst of all, Stephen slipped one day, fell off a cliff and broke his leg. The other boys picked their way down after him and then helped him back up to the top. They set his leg using sticks and leaves. “Don’t worry,” Sione joked. “We’ll do your work, while you lie there like King Taufa‘ahau Tupou himself!”
They survived initially on fish, coconuts, tame birds (they drank the blood as well as eating the meat); seabird eggs were sucked dry. Later, when they got to the top of the island, they found an ancient volcanic crater, where people had lived a century before. There the boys discovered wild taro, bananas and chickens (which had been reproducing for the 100 years since the last Tongans had left). Read the whole thing.